
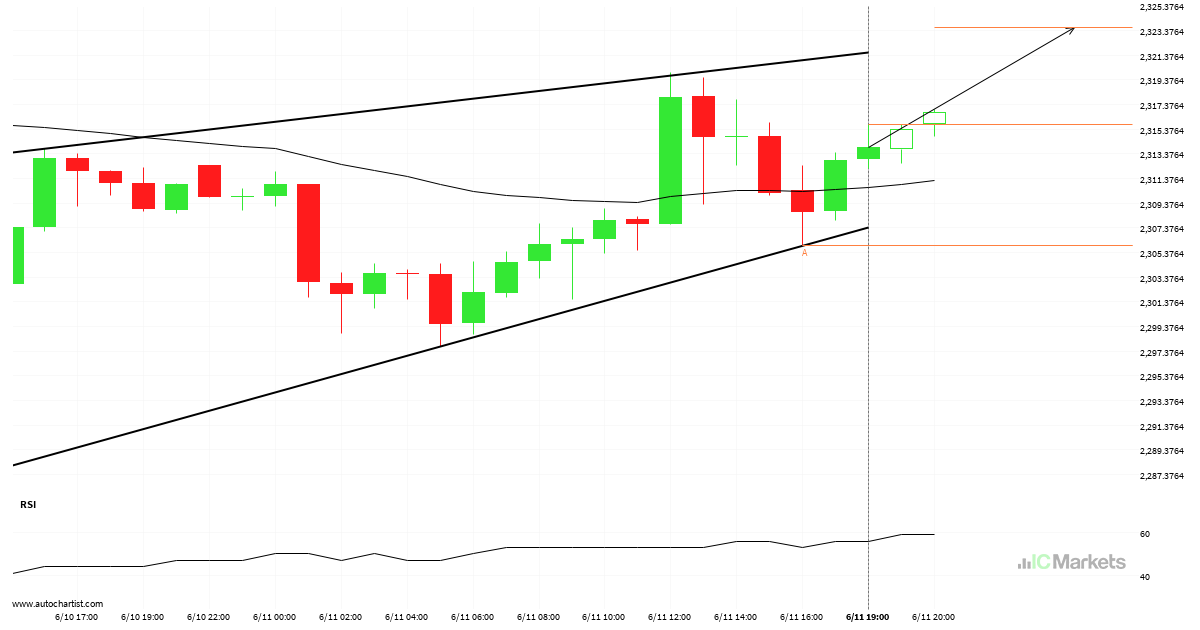
Will GOLD have enough momentum to break resistance?
Emerging Rising Wedge pattern in its final wave was identified on the GOLD 1 hour chart. After a strong bullish run, we find GOLD heading towards the upper triangle line with a possible resistance at 2323.6026. If the resistance shows to hold, the Rising Wedge pattern suggests a rebound back towards current levels.

SILVER is on the approach
A strong support level has been identified at 30.1880 on the 30 Minutes SILVER chart. SILVER is likely to test it soon.
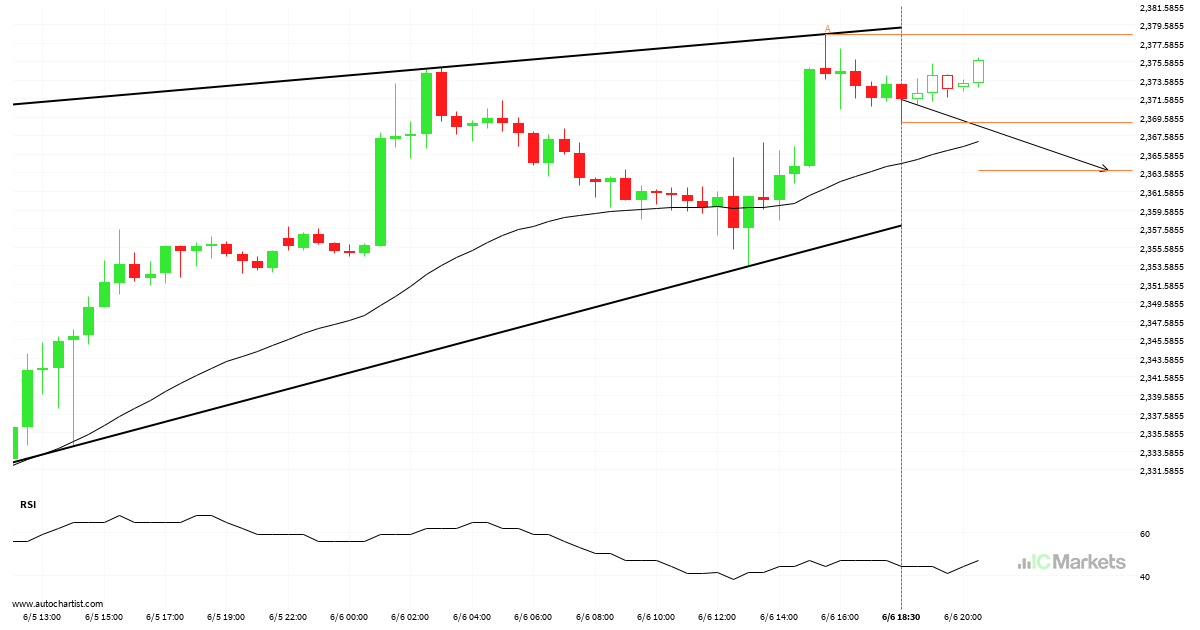
GOLD – Continuation Chart Pattern – Rising Wedge
An emerging Rising Wedge has been detected on GOLD on the 30 Minutes chart. There is a possible move towards 2363.8720 next few candles. Once reaching resistance it may continue its bearish run or reverse back to current price levels.
SILVER short term bullish trade setup to 30.9810
The price of SILVER in heading back to the resistance area. It is possible that it will struggle to break through it and move back in the other direction. The price may eventually break through, but typically the price retreats from the level a number of times before doing so.

Should we expect a breakout or a rebound on GOLD?
Emerging Falling Wedge detected on GOLD – the pattern is an emerging one and has not yet broken through resistance, but the price is expected to move up over the next few hours. The price at the time the pattern was found was 2325.42 and it is expected to move to 2309.6138.
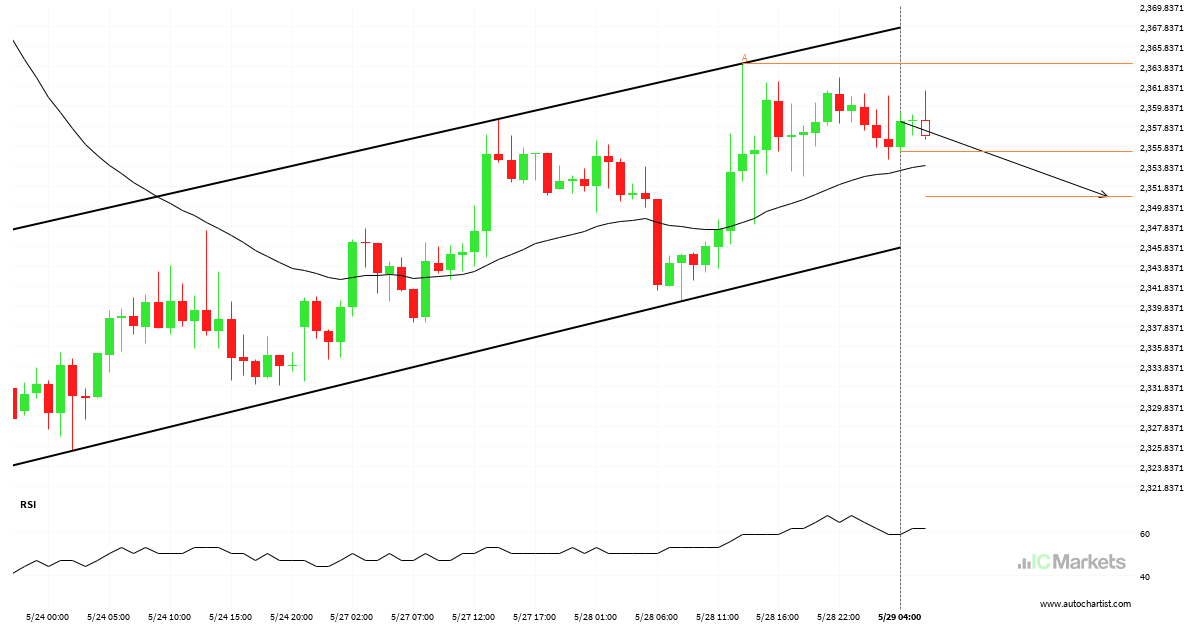
GOLD – Continuation Chart Pattern – Channel Up
GOLD is heading towards the support line of a Channel Up and could reach this point within the next 20 hours. It has tested this line numerous times in the past, and this time could be no different from the past, ending in a rebound instead of a breakout. If the breakout doesn’t happen, we […]
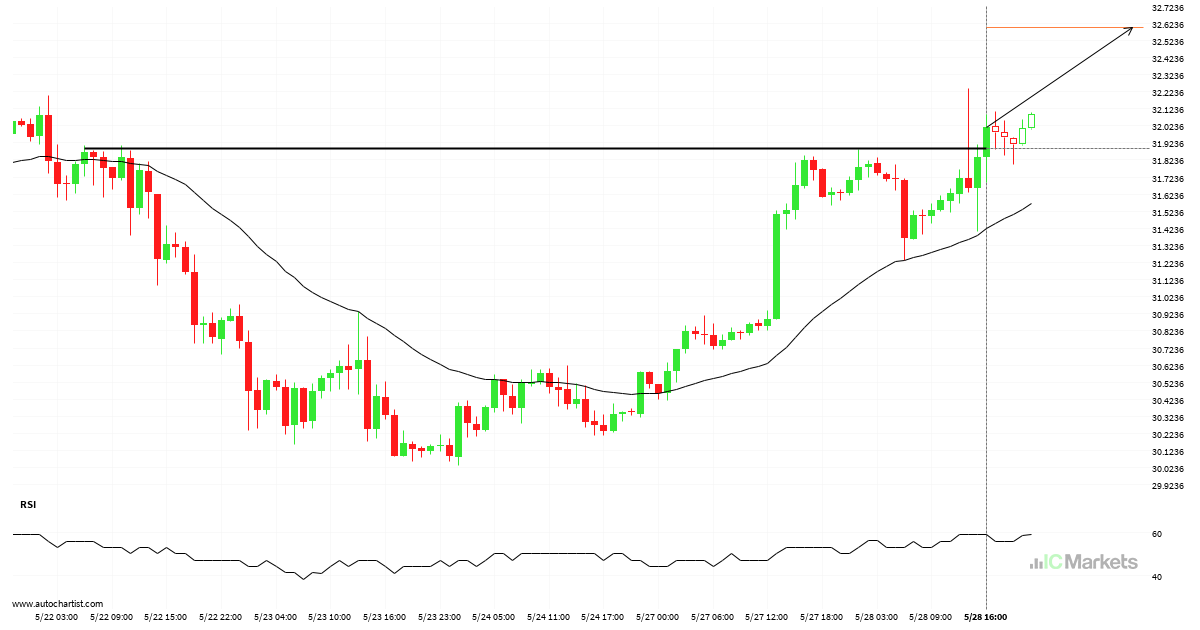
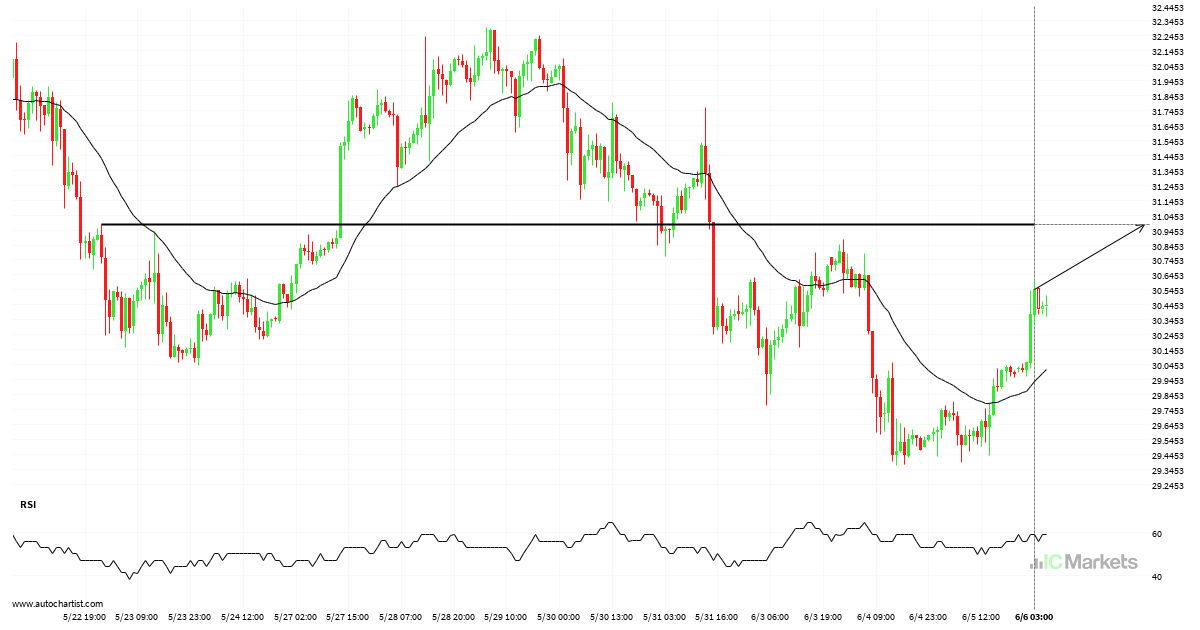
Big movement possible on SILVER
SILVER has broken through a line of 31.8920 and suggests a possible movement to 32.5958 within the next 19 hours. It has tested this line numerous times in the past, so one should wait for a confirmation of this breakout before taking any action. If the breakout doesn’t confirm, we could see a retracement back […]
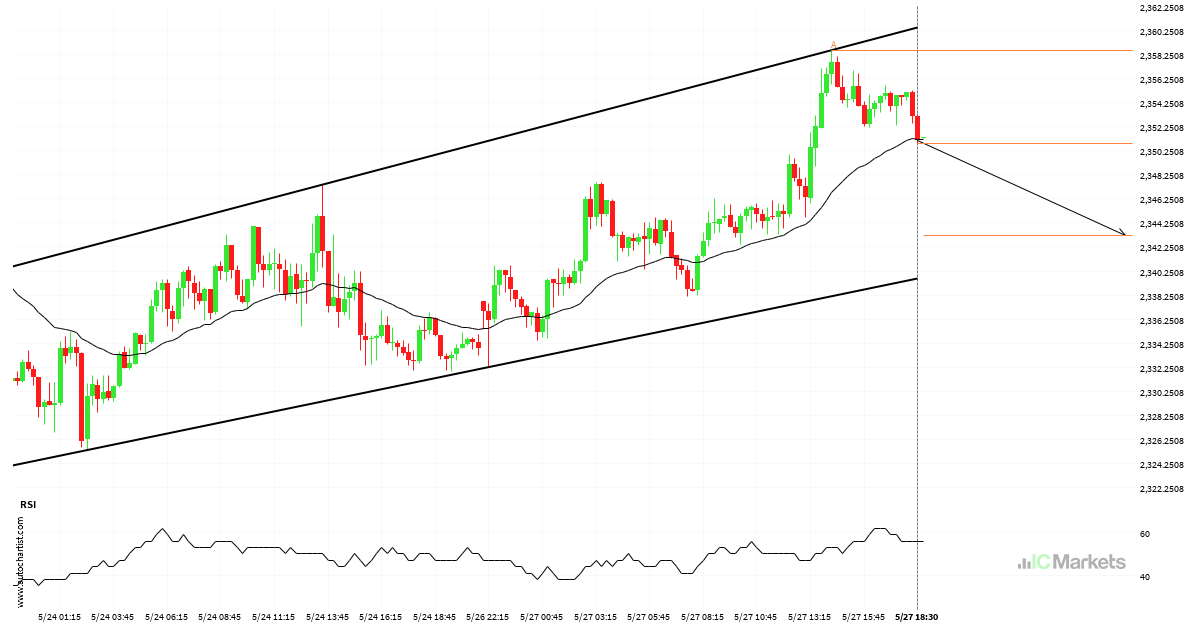
A potential bearish movement on GOLD
A Channel Up pattern was identified on GOLD at 2350.88, creating an expectation that it may move to the support line at 2343.2292. It may break through that line and continue the bearish trend or it may reverse from that line.
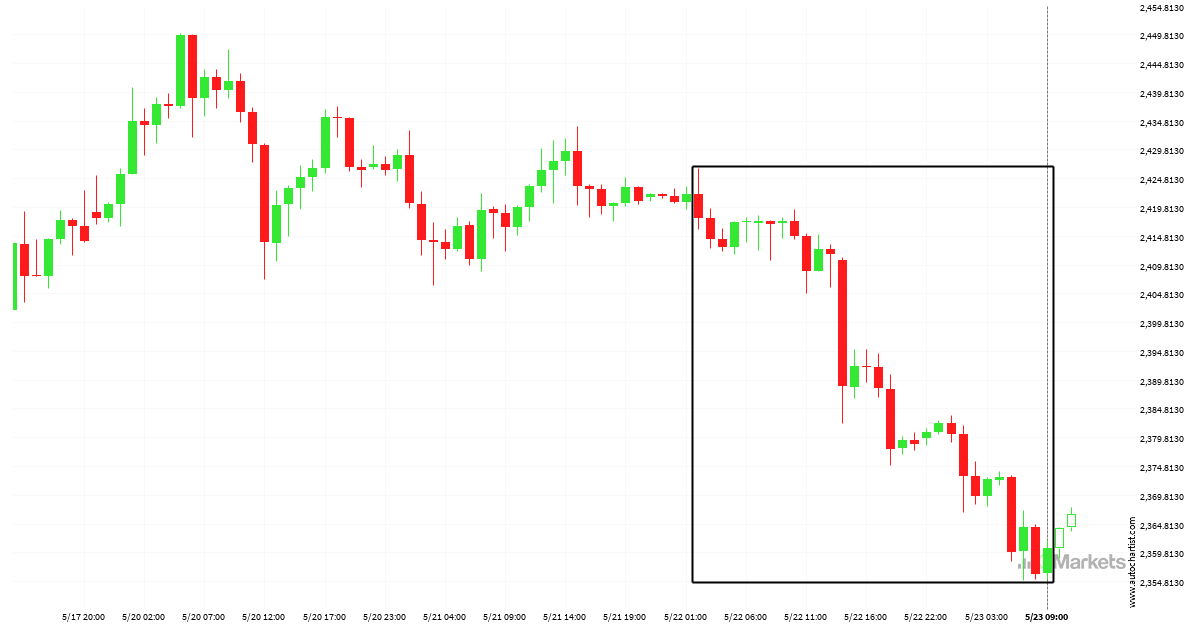
Extreme movement on GOLD
GOLD dropped sharply for day – which is an excessively big movement for this instrument; exceeding the 98% of past price moves. Even if this move is a sign of a new trend in GOLD there is a chance that we will witness a correction, no matter how brief.

GOLD breakout through support
The breakout of GOLD through the support line of a Triangle could be a sign of the road ahead. If this breakout persists, we may see the price of GOLD testing 2403.7820 within the next 17 hours.